Huron Consulting Group (HURN)·Q4 2025 Earnings Summary
Huron Beats on Record Revenue, Raises Buyback to $900M
February 24, 2026 · by Fintool AI Agent
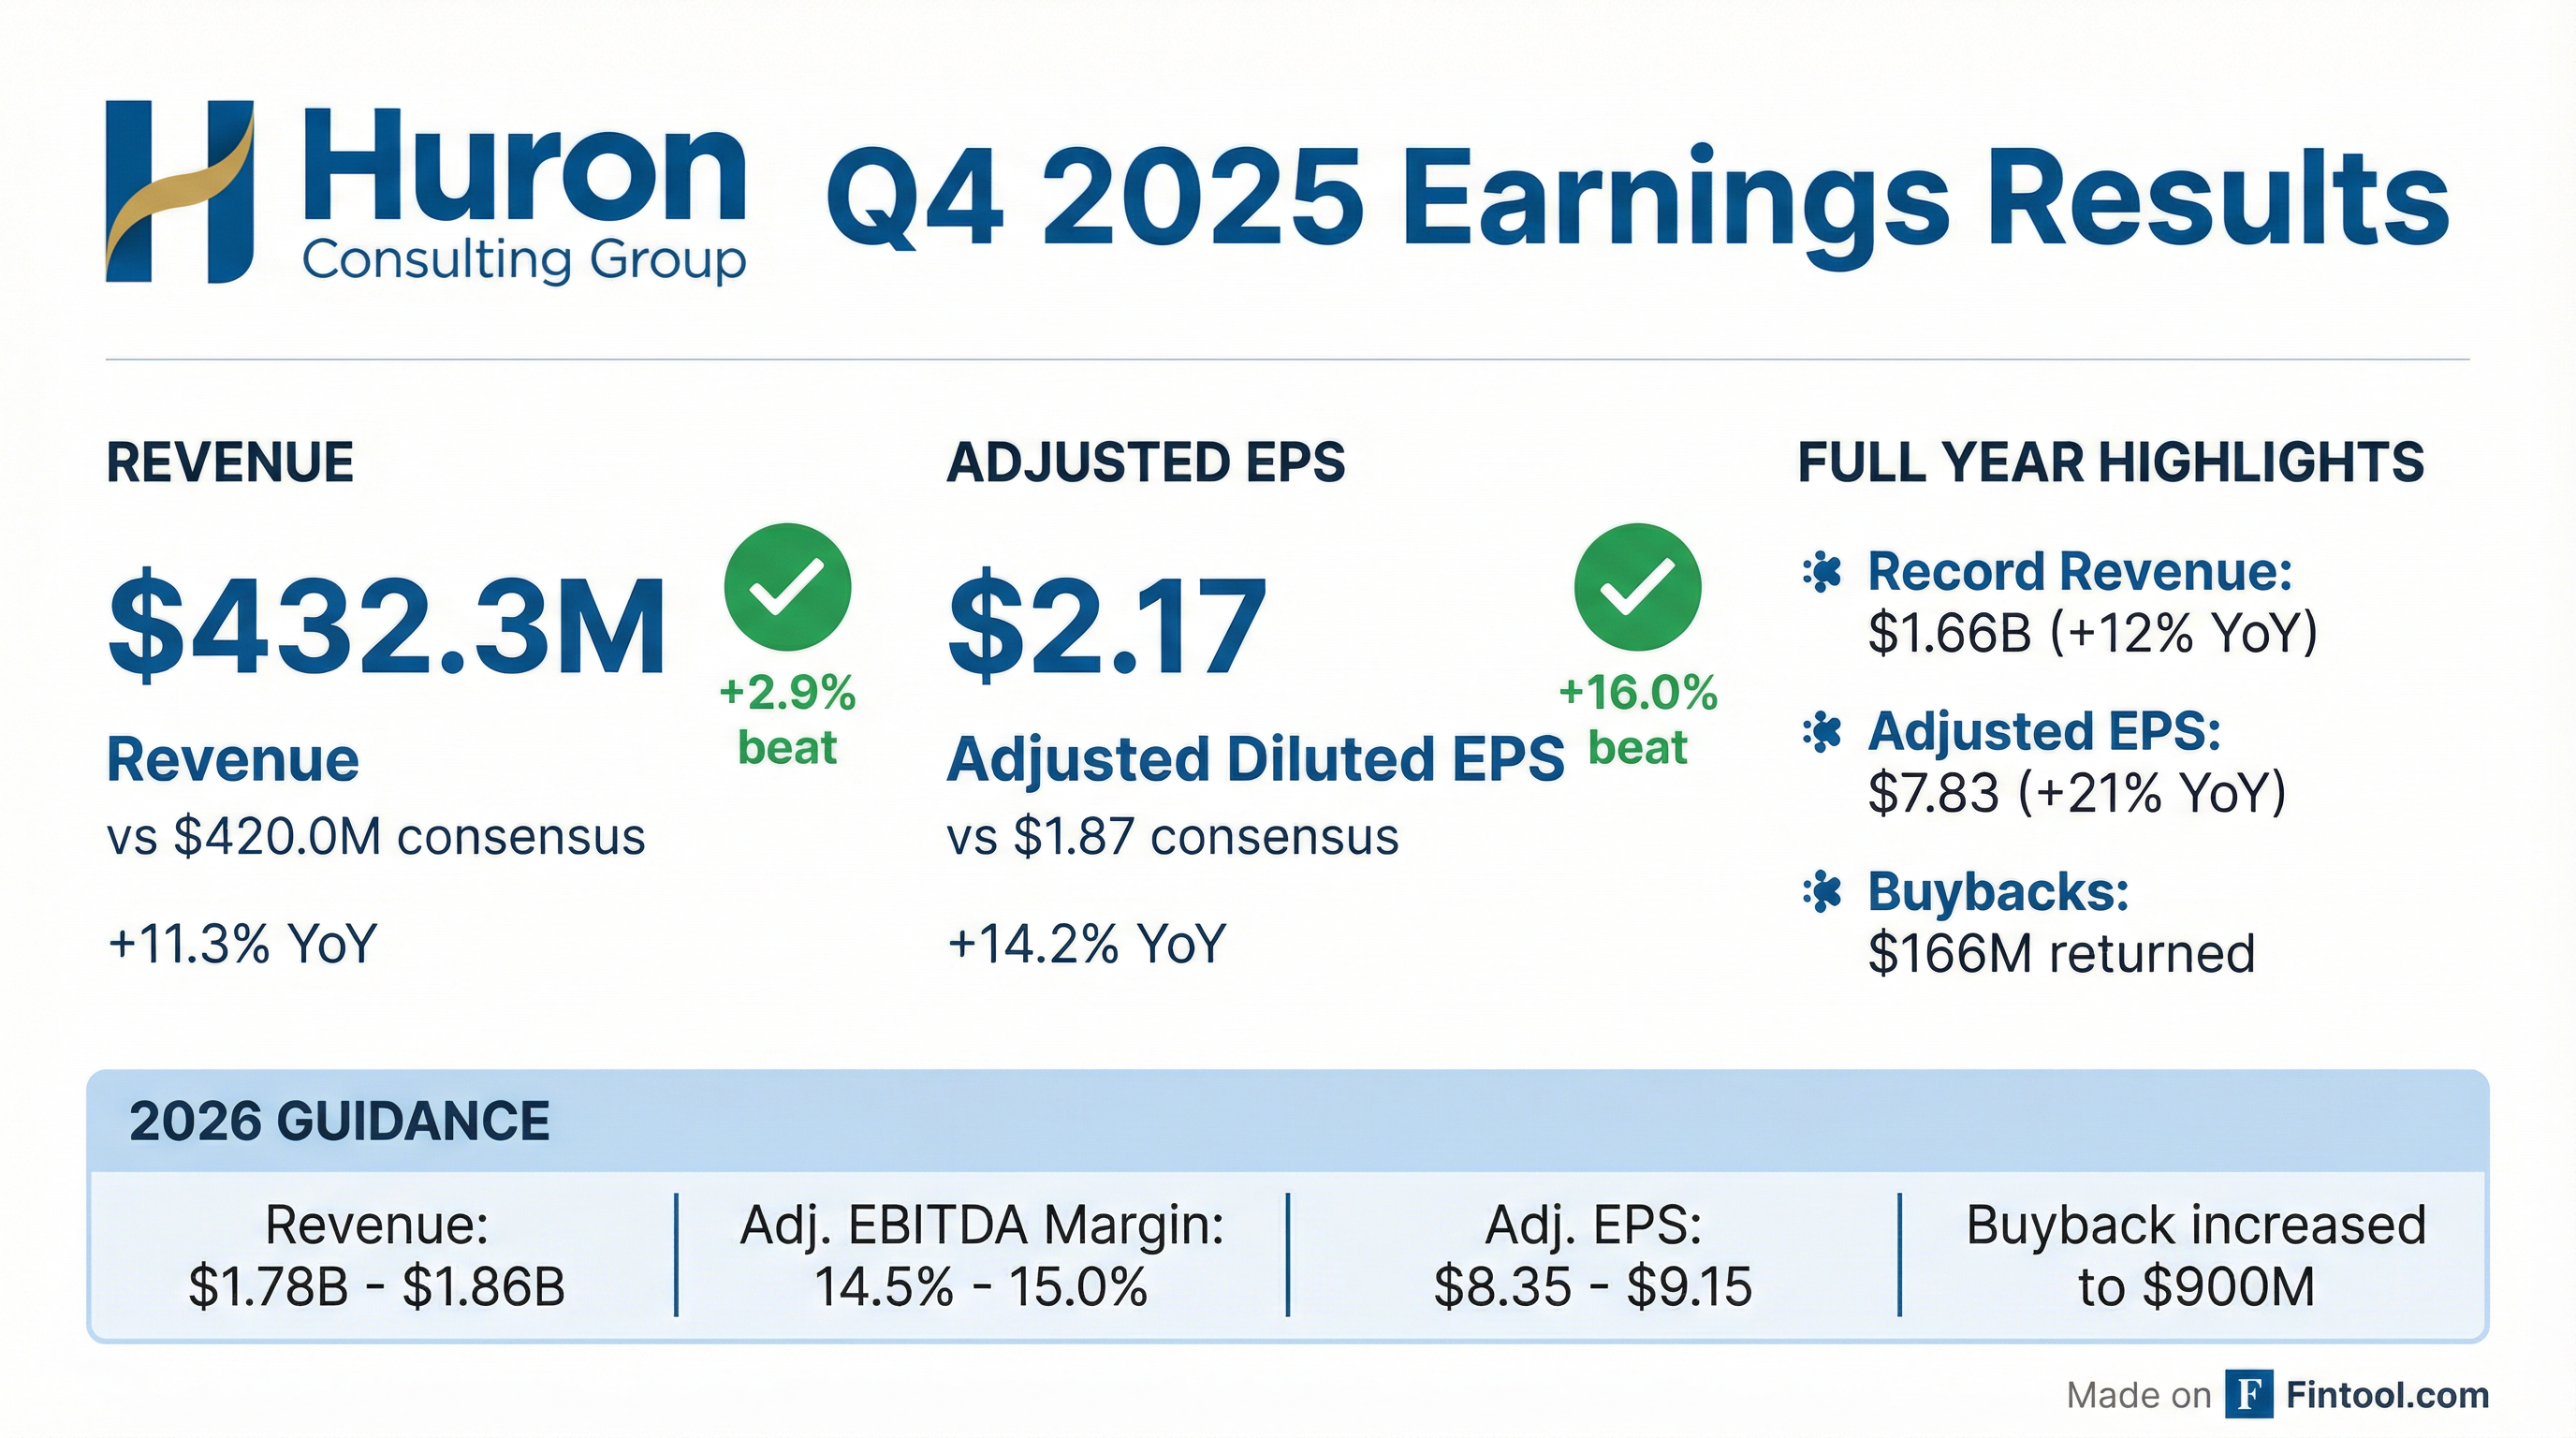
Huron Consulting Group delivered a double beat in Q4 2025, posting record quarterly revenue of $432.3 million (up 11.3% YoY) and adjusted diluted EPS of $2.17 (up 14.2% YoY). The professional services firm capped a fifth consecutive year of growth with record full-year revenue of $1.66 billion and 21% adjusted EPS expansion. Management raised the share repurchase authorization to $900 million and provided 2026 guidance in line with consensus.
Did Huron Beat Earnings?
Yes — Huron beat on both revenue and earnings.
The revenue beat was driven by record performance in Healthcare and Commercial segments, with $27.3 million of incremental revenue from acquisitions completed in the last twelve months. Excluding acquisitions and the divested Studer Education business, organic revenue grew 5.2%.
Adjusted EBITDA expanded to $68.0 million (15.7% margin), up 19.7% YoY from $56.8 million (14.6% margin). This marks the continuation of Huron's margin expansion trajectory.
8-Quarter Beat/Miss History:
*Values retrieved from S&P Global
Huron has beaten EPS estimates for 8 consecutive quarters.
What Did Management Guide?
Huron provided FY 2026 guidance that brackets Street consensus:
*Values retrieved from S&P Global
At the midpoint, guidance implies:
- Revenue growth of 9.5% ($1.82B midpoint vs. $1.66B in FY 2025)
- ~50 bps Adj. EBITDA margin expansion over FY 2025
- EPS growth of 11.7% ($8.75 midpoint vs. $7.83 in FY 2025)
Segment-Level Guidance:
Backlog & Pipeline Commentary:
Management highlighted the strongest hard backlog coverage of initial annual guidance in the last five years, while pipeline remains at near-record levels:
- Healthcare: 20%+ increase in H2 2025 bookings vs. H2 2024; continued strong January 2026 conversions
- Education: 10%+ increase in H2 2025 bookings vs. H2 2024; acceleration in January 2026 conversions
- Commercial: 20%+ increase in H2 2025 bookings vs. H2 2024; continued strong January 2026 conversions
Guidance vs. Prior: This is Huron's initial FY 2026 guidance. The implied growth rates are consistent with the financial goals outlined at the company's 2025 Investor Day.
How Did the Stock React?
Despite the double beat, shares traded down modestly on the day. The stock remains well off its 52-week high of $186.78, having pulled back amid broader market weakness. The muted reaction suggests the beat was largely expected given Huron's consistent outperformance track record.
What Changed From Last Quarter?
Key Differences vs. Q3 2025:
New This Quarter:
- Treliant acquisition completed in Q3 2025 added ~180 revenue-generating professionals to the Commercial segment
- Buyback authorization increased by $200M to $900M total
- Managed Services headcount grew 46.3% YoY to 2,239 professionals
Headcount Growth:
Segment Breakdown
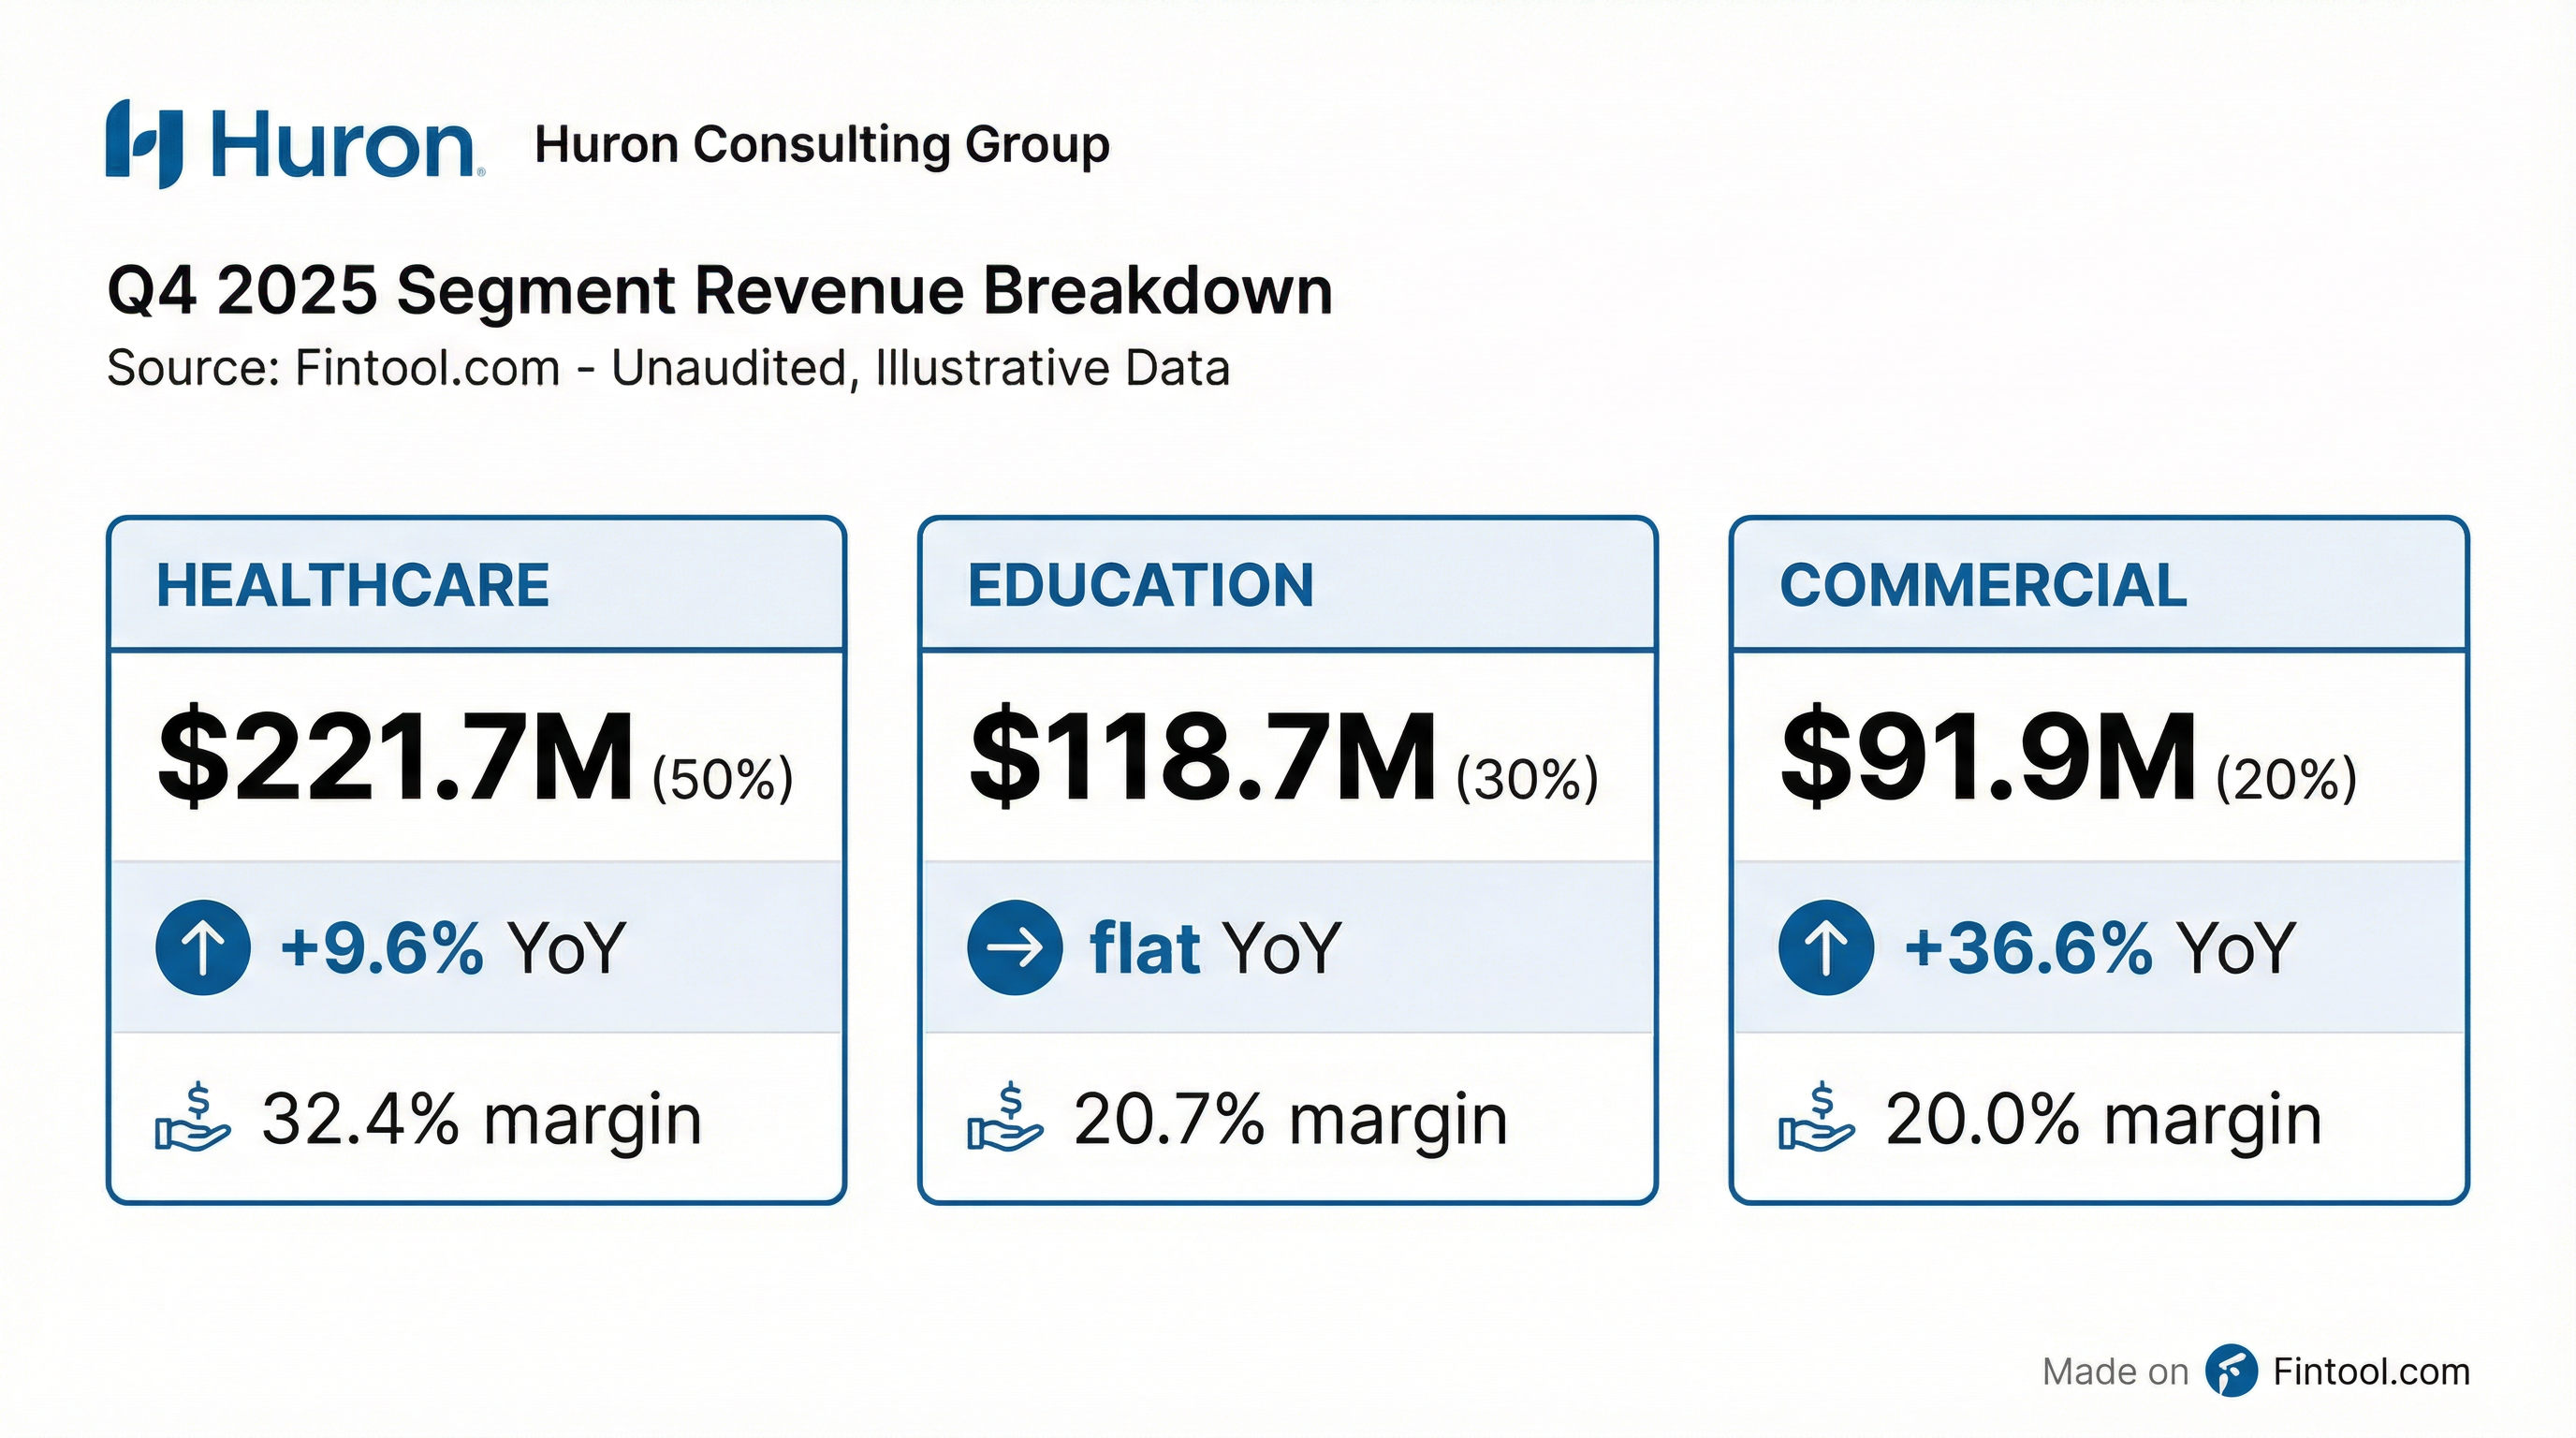
Healthcare — Record segment revenue driven by strong demand for Consulting and Managed Services capabilities. Operating margin expanded 210 bps YoY to 32.4%. Managed Services headcount in Healthcare grew to 2,117 (up 49% YoY).
Education — Revenue flat YoY with continued strength in Digital capability and research administration. Margin compression of 170 bps reflects investment in growth initiatives.
Commercial — Record segment revenue, up 36.6% YoY, driven by the Treliant acquisition and strong Digital demand. Operating margin expanded 220 bps to 20.0%.
AI: The Opportunity for Huron
Management released supplemental materials detailing their AI strategy and how it underpins the FY 2026 outlook. The strategy centers on three pillars:
1. Strengthening the Core
- Extending current offerings using AI accelerators leveraging proprietary IP
- Driving greater ROI and speed-to-value for consulting and managed services clients
2. Growing Addressable Market
- Delivering AI-focused offerings: strategy, governance, data modernization, agent development, scaled implementation
- Expanding technology partner ecosystem (Microsoft, Hippocratic AI, etc.)
3. Optimizing Operations
- Leveraging AI, automation, and advanced analytics to reduce cost of delivery
Recurring Revenue Mix Improvement:
Huron has steadily shifted toward more predictable revenue streams:
AI in Action — Illustrative Client Examples:
- Healthcare: Deployed Authorization AI and automation for a top academic health system, piloting solutions that reduced manual intervention on ~30% of urgent/emergent volumes
- Education: Applied AI-enabled funds management at a leading research institution, unlocking $20M in immediate funding and deploying $5M+ in restricted funds
- Commercial: Developed AI application for an industrials company to optimize equipment maintenance, delivering $40M+ in annual savings
Management emphasized that Huron's focus on "blue chip clients in mission-critical, highly regulated industries" requires "distinct understanding of clients' industries and business models, deep functional and operational knowledge, and a people-first approach to drive sustainable transformation" — positioning AI as an enabler rather than a displacer.
Full Year 2025 Highlights
Notable Items Impacting GAAP Results:
- FY 2025: $7.7M non-cash impairment charge on convertible debt investment
- FY 2024: $11.1M litigation settlement gain
Organic Growth: Excluding $86.0M from acquisitions and $13.7M from the divested Studer Education business, organic revenue grew 7.1% in FY 2025.
Capital Allocation
Buyback Update: Board increased authorization from $700M to $900M on February 19, 2026. Management has demonstrated commitment to returning capital with 6.6% of shares retired in 2025 alone.
Balance Sheet:
- Cash: $24.5M
- Total Debt: $509.7M
- Net Debt: $485.2M
- Net Debt / Adjusted EBITDA: ~2.0x
CEO Commentary
Mark Hussey, CEO:
"We finished 2025 with strong fourth-quarter results. Revenues before reimbursable expenses grew 11% in the fourth quarter of 2025, driven by record RBR in the healthcare and commercial segments. We also continued our trajectory of margin expansion in the quarter."
"Full year RBR grew 12% over 2024, resulting in record RBR and a fifth consecutive year of growth. We are pleased with our continued margin and earnings per share expansion in 2025, including achieving adjusted diluted earnings per share growth of 21% over 2024."
On the outlook:
"We believe the ongoing pressures facing our clients and primary end markets will continue to create significant near-term and long-term growth opportunities for Huron. We continue to help our clients solve their most complex challenges through our deep client relationships, industry and advanced technology expertise, including artificial intelligence (AI), and proven track record of delivering tangible results."
Key Takeaways
Positives:
- 8th consecutive EPS beat with 16% surprise
- Record revenue in Healthcare and Commercial segments
- Margin expansion continues (+80 bps Adj. EBITDA margin YoY)
- Buyback authorization raised $200M to $900M
- Fifth consecutive year of revenue growth
Watch Items:
- Education segment flat — bears monitoring
- GAAP net income declined due to investment impairment
- Guidance growth rate moderating (9-10% implied vs. 12% in 2025)
- Stock down 32% from highs despite strong execution
Forward Catalysts
- Q1 2026 Earnings — Expected late April/early May
- AI Integration Execution — Management detailed specific AI use cases; watch for conversion to incremental revenue
- M&A Activity — Continued tuck-in acquisition strategy (Treliant closed Q3 2025); strong balance sheet capacity
- Healthcare Tailwinds — Ongoing pressures from regulatory changes, workforce shortages, and technological evolution driving demand
- Education "Demographic Cliff" — Institutions facing enrollment pressures creating advisory opportunities
This analysis was generated by Fintool AI Agent based on Huron's Q4 2025 8-K filing and FY 2026 Outlook supplemental materials. For full financial statements and management discussion, see the 10-K filing.